L2 Probability
Question Bank
A telecommunications company collected 1,200 customer feedback forms detailing their satisfaction level and the channel they used to contact the company.
| Phone | Online Chat | Total | ||
|---|---|---|---|---|
| Satisfied | 410 | 280 | 190 | 880 |
| Unsatisfied | 140 | 90 | 90 | 320 |
| Total | 550 | 370 | 280 | 1200 |
(i) What proportion of the feedback forms were for a customer who was unsatisfied with the service?
(ii) If a customer contacted the company via Online Chat, what is the probability that they were satisfied?
A marketing company surveyed its customers about their loyalty program status and their average monthly spending. The proportions are summarized in the table below:
| Low Spending (<\$100) | High Spending (>\$100) | Total | |
|---|---|---|---|
| Loyalty Member | 0.32 | 0.48 | 0.80 |
| Non-Member | 0.15 | 0.05 | 0.20 |
| Total | 0.47 | 0.53 | 1.00 |
(a) What is the probability that a randomly chosen customer is a Loyalty Member?
(b) What is the probability that a customer is a Non-Member AND has High Spending?
A museum recorded the 400 visitors on one Saturday of the school holidays. The table shows whether each visitor was an adult or a child, and whether they went on a guided tour. Some entries are missing.
| Adult | Child | Total | |
|---|---|---|---|
| Guided tour | 90 | 70 | |
| No tour | 150 | ||
| Total | 160 | 400 |
(i) Complete the table.
(ii) What is the probability that a randomly chosen visitor is a child who did not go on a guided tour?
(iii) What proportion of the adults went on a guided tour?
A school tracked the participation of 600 students in an extracurricular club and the main subject they focused on (Arts or Science).
| Arts Focus | Science Focus | Total | |
|---|---|---|---|
| Club Member | 105 | 165 | 270 |
| Not Member | 185 | 145 | 330 |
| Total | 290 | 310 | 600 |
(i) What is the probability that a randomly chosen participant in this study is not a club member?
(ii) What proportion of students who have a Science focus are club members?
A stallholder at a farmers’ market surveyed 250 shoppers. The table shows whether each shopper bought fruit and whether they paid by card or with cash. Some entries are missing.
| Card | Cash | Total | |
|---|---|---|---|
| Bought fruit | 84 | 120 | |
| No fruit | 95 | ||
| Total | 71 | 250 |
(i) Complete the table.
(ii) What is the probability that a randomly chosen shopper paid by card?
(iii) A shopper paid with cash. What is the probability that they bought fruit?
A neighborhood group conducted a random survey of 450 households to investigate the relationship between pet ownership and housing type.
| Own Home | Rent Home | Total | |
|---|---|---|---|
| Owns a Dog | 180 | 55 | 235 |
| Owns a Cat | 110 | 35 | 145 |
| No Pets Listed | 30 | 40 | 70 |
| Total | 320 | 130 | 450 |
(i) What is the probability that a randomly chosen household owns a cat or a dog?
(ii) What proportion of the households that rent their home own a dog?
A health survey of 950 office workers investigated the relationship between their morning caffeine source and their self-reported energy level (High or Low) at 3 p.m. The 'Other' category includes those who drink only water or non-caffeinated drinks.
| Coffee Only | Tea Only | Other | Total | |
|---|---|---|---|---|
| High Energy | 190 | 110 | 150 | 450 |
| Low Energy | 120 | 180 | 200 | 500 |
| Total | 310 | 290 | 350 | 950 |
(i) What proportion of workers in the survey had low energy and consumed either tea or coffee?
(ii) If a randomly selected worker has a low energy level, find the probability that their caffeine source was Coffee Only.
(iii) It is claimed that more than half of all workers who only drink tea report low energy. Use the data to state whether this claim is true or false.
A gym has 500 members, with casual, monthly or annual memberships. The gym recorded whether each member went to at least one class this week.
- 40% of the members have a monthly membership.
- Three-quarters of the annual members went to a class.
| Class | No class | Total | |
|---|---|---|---|
| Casual | 15 | 60 | |
| Monthly | |||
| Annual | |||
| Total | 260 | 500 |
(i) Use the information above to complete the table.
(ii) What is the probability that a member with a monthly membership went to a class?
(iii) What proportion of the members who did not go to a class have an annual membership?
A sports physiotherapist recorded 420 club netball players over one season. The table shows whether each player usually warmed up properly before games, and whether they were injured during the season.
| Injured | Not injured | Total | |
|---|---|---|---|
| Warmed up | 42 | 238 | 280 |
| No warm-up | 35 | 105 | 140 |
| Total | 77 | 343 | 420 |
(i) What is the probability that a player who did not warm up was injured?
(ii) Calculate the relative risk of injury for players who did not warm up, compared with players who did. Interpret your answer in context.
A marketing company surveyed 800 online shoppers about how frequently they shop (Weekly/Monthly/Rarely) and their preferred device (Mobile or Desktop).
Table 1: Online Shopping Habits Survey
| Mobile | Desktop | Total | |
|---|---|---|---|
| Weekly | 210 | A | 340 |
| Monthly | 150 | B | 250 |
| Rarely | C | D | E |
| Total | F | G | 800 |
Use the following information to help complete the table, and then answer the questions:
- The probability that a shopper prefers Desktop and shops Monthly is $\frac{1}{8}$.
- $40\%$ of the shoppers who shop Rarely prefer a Mobile device.
(i) Complete the entries A, B, C, D, E, F, G in the table.
(ii) What is the probability that a randomly chosen shopper prefers Mobile, given they shop at least Monthly (i.e., Weekly or Monthly)?
(iii) If 6,400 customers are on the company's mailing list, what is the expected number of customers who prefer a Desktop and shop Weekly?
An online clothing shop looked at 750 orders. It recorded whether the customer read the product reviews before buying, and whether they returned the item.
| Returned | Kept | Total | |
|---|---|---|---|
| Read reviews | 63 | 387 | 450 |
| Did not read | 60 | 240 | 300 |
| Total | 123 | 627 | 750 |
(i) What is the probability that a randomly chosen order was returned?
(ii) Calculate the relative risk of returning an item for customers who read the reviews, compared with customers who did not. Interpret your answer in context.
A transport survey asked 750 commuters about their primary method of transport to work/study and their age group (Under 30 or 30+).
| Car | Public Transport | Walk/Cycle | Total | |
|---|---|---|---|---|
| Under 30 | 185 | 110 | 75 | 370 |
| 30+ | 240 | 65 | 75 | 380 |
| Total | 425 | 175 | 150 | 750 |
(i) What is the probability a randomly chosen participant in this survey is under 30 and walk or cycle?
(ii) If a commuter does not use a car, find the probability that they are aged 30+ or use public transport.
(iii) If 5,000 people live in the area, what is the expected number of people who are under 30 and drive a car?
A manufacturing plant produces two types of items (A and B). A sample of 1,000 defective items over a year was analysed, categorized by item type and shift.
Table 1: Defective Items Breakdown
| Day Shift | Night Shift | Total | |
|---|---|---|---|
| Item A Defect | 0.45 | 0.15 | 0.60 |
| Item B Defect | 0.25 | 0.15 | 0.40 |
| Total | 0.70 | 0.30 | 1.00 |
(i) What is the probability that a randomly chosen defective item was produced on the Night Shift?
(ii) If the plant produces 20,000 items per year, what is the expected number of defective Item B pieces produced during the Night Shift?
(iii) If a defective item was produced during the Day Shift, find the probability that the item was Type B.
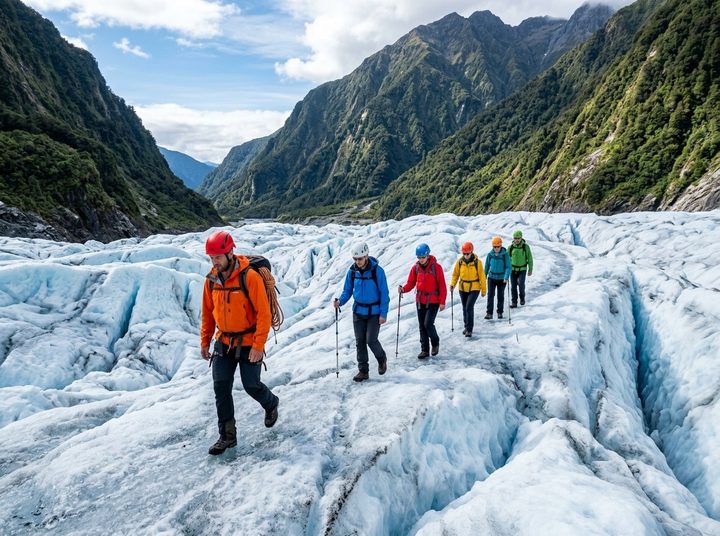
A visitor centre surveyed 800 tourists about where they come from and whether they went on a guided glacier walk.
- 45% of the tourists were from New Zealand.
- The probability that a randomly chosen tourist went on a glacier walk is 0.35.
- 30% of the Australian tourists went on a glacier walk.
| Walk | No walk | Total | |
|---|---|---|---|
| New Zealand | |||
| Australia | 200 | ||
| Other | 85 | ||
| Total | 800 |
(i) Use the information above to complete the table.
(ii) A tourist went on a glacier walk. What is the probability that they are from New Zealand?
(iii) Were the tourists from New Zealand or the tourists from other countries (not Australia) more likely to go on a glacier walk? Use calculations to support your answer.
A university department conducted a survey on 500 first-year students to study the relationship between where they studied (library or home) and their exam result (Pass or Fail).
| Pass | Fail | Total | |
|---|---|---|---|
| Library | 140 | 40 | 180 |
| Home | 270 | 50 | 320 |
| Total | 410 | 90 | 500 |
(i) What is the probability that a randomly chosen student passed the exam?
(ii) What is the probability that a randomly chosen participant in this survey who studied at the library passed?
(iii) A concerned lecturer notices that most students in the library spend more time passing notes to their friends than studying. He claims that students studying at the library are twice as likely to fail than students who study at home. Evaluate this claim, supporting your answer with calculations.
A recent survey was conducted in a major city to gauge public interest in electric scooters. The survey randomly sampled 850 adults, asking if they owned an electric scooter and their gender.
| Owns Scooter | Does Not Own Scooter | Total | |
|---|---|---|---|
| Male | 190 | 280 | 470 |
| Female | 120 | 260 | 380 |
| Total | 310 | 540 | 850 |
(i) What proportion of the people surveyed were female and did not own an electric scooter?
(ii) If a person selected at random owns an electric scooter, what is the probability that they are male?
(iii) The city council suggests that males are more than twice as likely as females to own an electric scooter. Use a calculation to determine if this claim is statistically supported by the data. Interpret your result in context.
A weather service tracked 1,500 forecasts over a year, categorizing them by the forecast range (Short-Range: next 48 hours, or Long-Range: next 7 days) and the final outcome.
Table 1: Forecast Accuracy vs. Range
| Short-Range | Long-Range | Total | |
|---|---|---|---|
| Correct Prediction | 780 | 320 | 1100 |
| Incorrect Prediction | 120 | 280 | 400 |
| Total | 900 | 600 | 1500 |
(i) A new weather app advertises that a Long-Range forecast is more than 3 as likely to be incorrect as a Short-Range forecast. Is this claim supported by the data? Show your calculation and interpretation.
(ii) Another meteorologist asserts that the chance of a forecast being Correct is about 60% higher for a Short-Range forecast than for a Long-Range forecast. Evaluate this assertion using an appropriate calculation.
A vet clinic followed 600 dogs until they were eight years old. It recorded whether each dog was walked daily and whether it developed joint problems (“Sore joints” in the table).
- 60% of the dogs were walked daily.
- Half of the dogs that developed joint problems were walked daily.
| Sore joints | Healthy joints | Total | |
|---|---|---|---|
| Walked daily | |||
| Not walked daily | |||
| Total | 132 | 600 |
(i) Use the information above to complete the table.
(ii) A pet magazine claims that a dog that is not walked daily is 80% more likely to develop joint problems than a dog that is walked daily.
Use the data to evaluate this claim. Use relative risk, and interpret it in context.
A tramping club recorded the footwear of 320 members on a three-day tramp, and whether they got blisters.
| Blisters | No blisters | Total | |
|---|---|---|---|
| Boots | 48 | 192 | 240 |
| Trail shoes | 28 | 52 | 80 |
| Total | 76 | 244 | 320 |
The club secretary says, “Boots are more likely to give you blisters. 48 people in boots got blisters, but only 28 people in trail shoes did.”
(i) Explain why the secretary’s reasoning is flawed.
(ii) Use relative risk to show whether boots or trail shoes were linked with a higher risk of blisters on this tramp. Interpret your answer in context.
A health researcher collected data on the sleep habits of 650 adults. The table shows the proportions of participants broken down by average sleep duration and exercise frequency.
Table 1: Sleep Duration and Exercise Frequency
| Regular Exercise | Occasional Exercise | Rarely Exercise | Total | |
|---|---|---|---|---|
| Sleep $< 8$ Hrs | 0.15 | 0.20 | 0.10 | 0.45 |
| Sleep $\geq 8$ Hrs | 0.25 | 0.20 | 0.10 | 0.55 |
| Total | 0.40 | 0.40 | 0.20 | 1.00 |
(i) What is the probability that a randomly chosen participant exercises occasionally, given that they sleep less than 8 hours?
(ii) What proportion of participants sleep 8 hours or more and exercise regularly?
(iii) A fitness influencer claims that getting regular excercise increases the chance you'll sleep longer by a lot. Discuss this claim, along with comparing any relevant probabilities in an appropriate way.
A university trial studied the pass rates of a large introductory course, comparing the method of instruction with the final result. A sample of 850 students gave the following results:
Table 1: Course Method vs. Result
| Online Only | In-Person Only | Total | |
|---|---|---|---|
| Pass | 290 | 430 | 720 |
| Fail | 70 | 60 | 130 |
| Total | 360 | 490 | 850 |
(i) A university administrator claims that students who study In-Person are less than half as likely to fail the course as students who study Online. Use a calculation to test this claim. Interpret your result in context.
(ii) Another study suggests that the proportion of students who Fail is $1.5$ times greater for those who study Online compared to those who study In-Person. Determine if the data in the table supports this claim.
A school trialled a reading app with its 480 Year 9 students. At the end of the year, every student sat a reading check. Three-fifths of the students used the app.
| Failed | Passed | Total | |
|---|---|---|---|
| Used the app | 36 | ||
| Did not use it | |||
| Total | 76 | 480 |
(i) Complete the table.
(ii) The school newsletter says, “Using the app halves a student’s chance of failing the reading check.”
Use relative risk to evaluate this claim, and interpret your answer in context.
A college surveyed 1,000 students about their daily commute and course load (categorized as Heavy or Light). A second part of the survey related travel time to satisfaction.
| Heavy Course Load | Light Course Load | Total | |
|---|---|---|---|
| Bus/Train | 150 | 220 | 370 |
| Car/Walk | 280 | 350 | 630 |
| Total | 430 | 570 | 1000 |
The survey also found the following satisfaction rates for students independent of transport mode
- 85% of Light Course Load students were Satisfied.
- 40% of Heavy Course Load students were Satisfied.
(i) What proportion of all students surveyed have a Light Course Load?
(ii) If a randomly chosen student has a Heavy Course Load, find the probability that they commute by Car/Walk.
(iii) Calculate the proportion of all 1,000 students in the survey who commute by Bus/Train and are Satisfied.