L2 Probability
Question Bank
Marcus works at a fitness center and is tracking the daily step counts of gym members who use the facility's tracking app. The app advertises that the average gym member takes 9,500 steps per day, with a standard deviation of 1,200 steps. Marcus collects data from 45 randomly selected members over one week and records their average daily step counts in the graph below.
How do Marcus's results compare to a normal distribution model with a mean of 9,500 steps and a standard deviation of 1,200 steps?
You should discuss at least TWO of centre, shape, and spread in your response.
A smartphone manufacturer conducted 80 battery life tests on their new model. Each test started with a full charge and ended when the battery reached 10% capacity. Each test involved continuous video playback at maximum brightness in a climate-controlled room. The results are shown in the histogram below.
The smartphone manufacturer claimed that their new model can achieve 15 hours of battery life on average and that battery life would be normally distributed, with a standard deviation of 1.5 hours.
Evaluate this claim by:
- comparing the shape, centre, and spread of the histogram in Figure 1 with the claimed normal distribution
- providing numerical values where appropriate
- considering the quality of the testing that led to the results reported in Figure 1.
If the coffee machine was operating correctly, the volume of coffee dispensed into a cup would be normally distributed as shown in Figure 1 below.
Figure 1
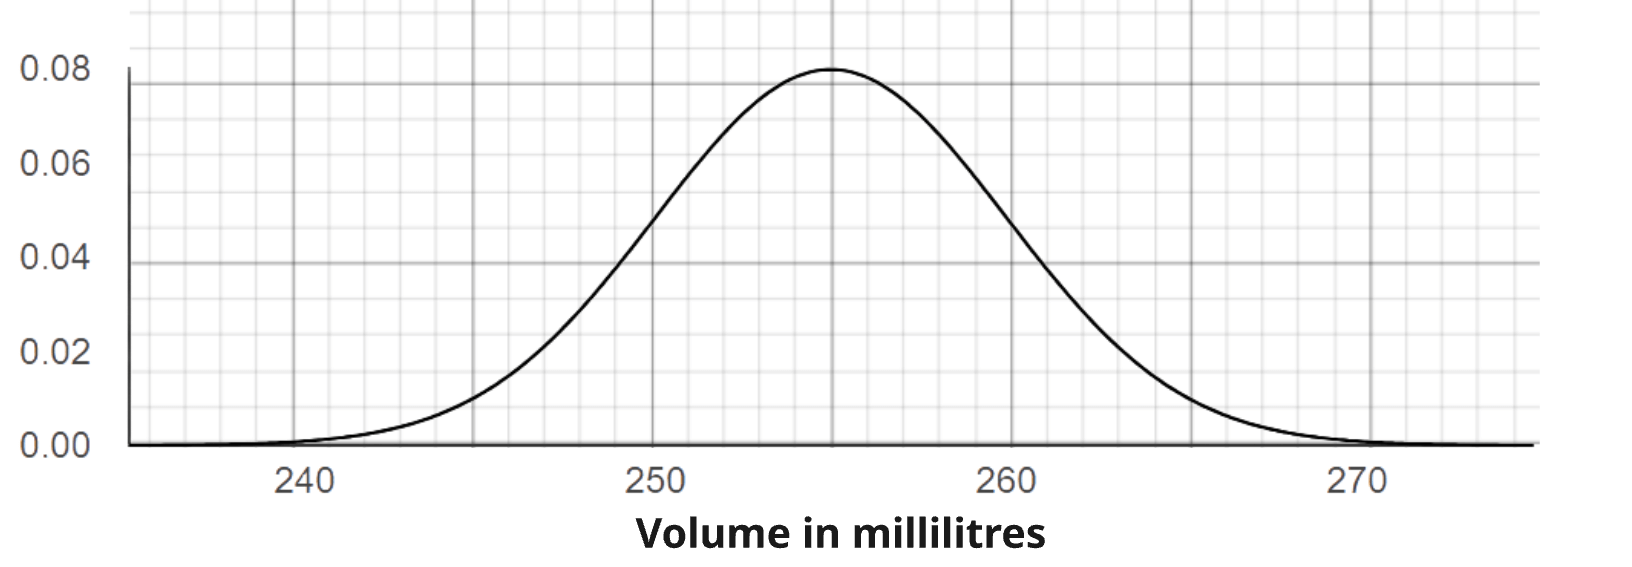
A new coffee machine is installed.
A random sample is taken of the contents of 120 cups to test the new machine. The results are shown in the frequency histogram in Figure 2 below.
Figure 2
(i) What proportion of cups in the sample had contents that were under-volume (i.e. the contents measured less than 250 milliliters)?
(ii) Compare the probability distribution with the frequency histogram that was obtained from the results of the sample.
In your answer, you should consider the shape, centre, and spread of both distributions and provide numerical evidence.
A pharmaceutical company manufactures vitamin tablets and claims that the vitamin C content per tablet is normally distributed with a mean of 500 mg and a standard deviation of 12 mg.
A quality control inspector tests 100 randomly selected tablets from a recent production batch. The vitamin C content (in mg) of these tablets is summarized in the frequency table below.
| Vitamin C Content (mg) | Frequency |
|---|---|
| $470 \le c < 480$ | 8 |
| $480 \le c < 490$ | 22 |
| $490 \le c < 500$ | 35 |
| $500 \le c < 510$ | 25 |
| $510 \le c < 520$ | 8 |
| $520 \le c < 530$ | 2 |
| Total | 100 |
Evaluate the company's claim by:
- comparing the shape, centre, and spread of the frequency distribution with the claimed normal distribution
- providing numerical values where appropriate
- considering the quality of the evidence and whether the claim appears to be justified.