L3 Probability Concepts
Question Bank
Each year, a survey asks households in a Southland town whether they still have a landline phone. The graph shows the percentage of the households that had a landline from 2019 to 2025.
A local newspaper claims that the proportion of the town's households with a landline fell every year from 2019 to 2025.
Does the data support this claim? Support your answer with values from the graph.
A board game uses a spinner with six equal sectors, numbered 1 to 6. Over several whānau games nights, the spinner was spun 400 times, with these results:
| Number | 1 | 2 | 3 | 4 | 5 | 6 |
|---|---|---|---|---|---|---|
| Frequency | 62 | 71 | 66 | 70 | 61 | 70 |
For these 400 spins, which was more likely: a number of 2 or less, or a number of 5 or more? Support your answer with statistical calculations.
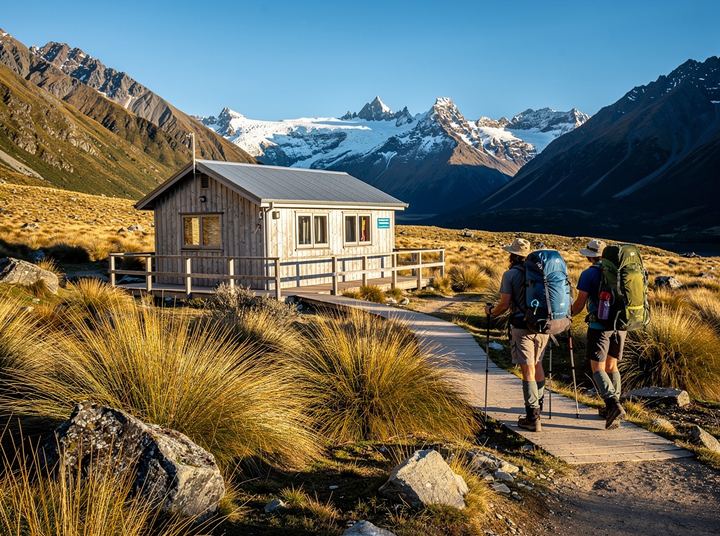
Huts on New Zealand’s Great Walks must be booked in advance. For one Great Walk hut in the 2025 season:
- the booking records show that 1680 of the 4800 bookings were made by international visitors
- the hut’s ranger thinks that about 40% of bookings are made by international visitors
- a researcher chose 200 of the season’s bookings at random, and 82 of them were made by international visitors.
Give the true probability, the theoretical (model) estimate and the experimental estimate that a randomly chosen booking for the 2025 season was made by an international visitor. Say where each one comes from.
A Year 13 class collected the heights (in cm) that 60 students typed into an online survey. The bar graph shows the last digit of each height (for example, 167 cm has last digit 7).
(a) Assuming that the last digit of a height is determined by chance alone, give a theoretical (model) estimate for the probability that a height ends in 0.
(b) Use the class’s data to estimate the probability that a height typed into this survey ends in 0 or 5.

In July 2025, a tourism researcher surveyed 400 visitors arriving at Queenstown Airport. 260 of them said they planned to ski or snowboard during their stay.
Estimate the probability that a visitor to Queenstown plans to ski or snowboard, and give ONE reason why this can only be an approximation.
An automatic counter on a city’s coastal path records each trip past it as either a bike trip or a walking trip. The graph shows the number of trips counted (in thousands) each year from 2022 to 2025.
(a) In which year did bike trips make up the highest proportion of the trips counted? Support your answer with calculations.
(b) Give ONE reason why these proportions are only estimates of the true proportion of trips on the path that are made by bike.
A bike shop in a city asked 150 customers who came into the shop on a Saturday in March whether they ride a bike to work or study at least once a week. 96 of them said yes.
The shop’s owner claims that 64% of adults in the city ride a bike to work or study at least once a week.
Give ONE reason why care should be taken when using this data to make this claim, and explain how it could affect the estimate.
A city planner uses the probability distribution below to model the number of people living in a household in the city.
| People in household | Probability |
|---|---|
| 1 | 0.26 |
| 2 | 0.36 |
| 3 | $n$ |
| 4 | 0.12 |
| 5 | 0.07 |
| 6 or more | 0.04 |
(a) Estimate the proportion of households in the city with three or more people.
(b) A real estate agent claims that at least twice as many households have one or two people as have three or more people. Does the model support this claim?
A cereal brand puts one of five rugby collector cards, A, B, C, D or E, in each box. The brand says that each card is equally likely.
A collectors’ club recorded the cards found in 1000 boxes:
| Card | A | B | C | D | E |
|---|---|---|---|---|---|
| Number | 211 | 203 | 219 | 150 | 217 |
A simulation drew many samples of 1000 boxes, assuming each card is equally likely. In the graph, the blue bars show the relative frequency of each card in the club’s 1000 boxes. The grey band shows the variation expected for each card in samples of 1000 boxes when the five cards are equally likely.
Does this data support the brand’s claim that the five cards are equally likely? Use the simulation results to support your answer.
At a large secondary school, each new student is put into one of four houses: Kauri, Rimu, Tōtara or Matai. The school says this is done at random, so each house is equally likely.
This year 60 new students joined the school: 19 went into Kauri, 12 into Rimu, 15 into Tōtara and 14 into Matai. A parent claims that the school is more likely to put a new student into Kauri than into the other houses.
A teacher simulated many intakes of 60 new students, each equally likely to go into any of the four houses. The blue bars show this year’s relative frequencies. The grey band shows the variation expected for each house when 60 students are put into houses at random.
Does the simulation support the parent’s claim? Use the simulation results to support your answer.
In Term 1 of 2026, all 240 Year 12 students at a Hamilton secondary school answered a survey about part-time jobs and driver licences. In the table, “Job” means the student has a part-time job and “Licence” means they have a restricted or full driver licence.
| Licence | No licence | Total | |
|---|---|---|---|
| Job | 64 | 32 | 96 |
| No job | 56 | 88 | 144 |
| Total | 120 | 120 | 240 |
(a) Calculate the probability that a randomly chosen Year 12 student at this school has a part-time job, given that they have a licence.
(b) Give ONE reason why care should be taken when using this data to estimate the proportion of all New Zealand Year 12 students who have a part-time job. Explain how it could affect the estimate.
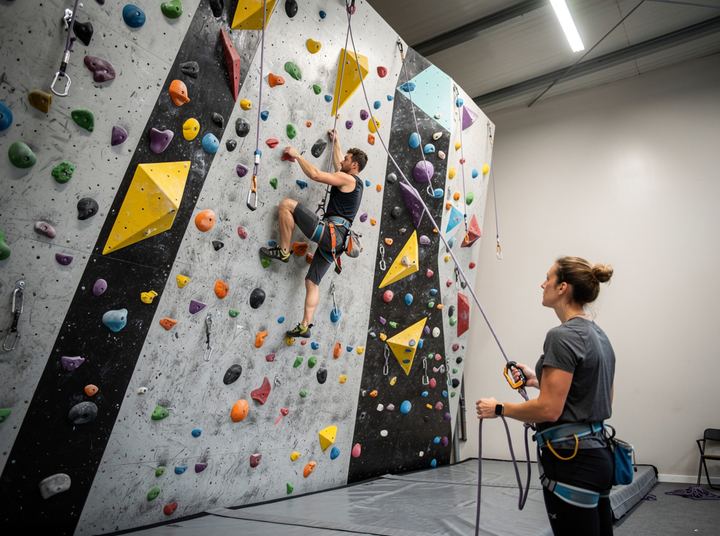
An indoor climbing centre records every visit. For 2025:
- the centre’s records show that 1320 of the 4400 visits were by people under 18
- the owner thinks that about half of visits are by people under 18
- a staff member noted the 50 people who came in one weekday lunchtime during the school term, and 9 of them were under 18.
(a) Calculate the true probability, the theoretical (model) estimate and the experimental estimate that a visit to the centre in 2025 was by a person under 18.
(b) Compare the true probability, the theoretical estimate and the experimental estimate. Discuss which estimate is the most reliable for predicting the proportion of visits by people under 18 in 2026. Use statistical reasoning to support your answer.
A city council says that 20% of household recycling bins in the city are contaminated (they contain items that can’t be recycled). Each week an auditor is meant to choose 40 bins at random and check them.
One week, the auditor reported that only 2 of the 40 bins were contaminated.
(a) Explain why the council might be suspicious that the auditor did not choose this week’s 40 bins at random. Support your answer with calculations comparing expected and observed counts.
The council then ran a simulation of 1000 audits. In each simulated audit, 40 bins were chosen at random, each with a 0.2 chance of being contaminated. The table shows how many contaminated bins the simulated audits found.
| Contaminated bins | Number of audits |
|---|---|
| 2 or fewer | 8 |
| 3 or 4 | 71 |
| 5 or 6 | 204 |
| 7 or 8 | 311 |
| 9 or 10 | 249 |
| 11 or 12 | 114 |
| 13 or 14 | 36 |
| 15 or more | 7 |
(b) Based on these simulation results, what could the council conclude about this week’s audit?
A sports-drink company asked 500 runners at the finish line of a Wellington marathon in June whether they drink a sports drink at least once a week. 340 of them said yes.
Give TWO reasons why care should be taken when using this data to estimate the proportion of all New Zealand adults who drink a sports drink at least once a week.
A district council surveys homes about solar power every three years. The table shows the percentage of ALL homes in the district that had solar panels without a home battery, and the percentage that had solar panels with a home battery (to store power for later).
| Year | Solar, no battery | Solar and battery |
|---|---|---|
| 2016 | 4% | 1% |
| 2019 | 5% | 1% |
| 2022 | 7% | 2% |
| 2025 | 9% | 3% |
(a) Has the percentage of homes in the district with solar panels increased between 2016 and 2025? Support your answer with statistical reasoning.
(b) For homes with solar panels, comment on how the chance of also having a home battery changed between 2016 and 2025. Support your answer with statistical reasoning.
A chocolate company’s promotion says that 1 in 6 wrappers wins a free bar. Students in a Year 13 class bought 120 of the promotion’s bars between them, and 12 of the wrappers were winners. Assume these 120 bars are a random sample of the promotion’s bars.
(a) Give the theoretical (model) estimate and the experimental estimate of the probability that a wrapper wins a free bar.
(b) Discuss how carrying out a simulation would help the class consider whether their 120 bars could indicate that the proportion of winning wrappers is less than 1 in 6. As part of your answer, describe what result from the simulation would suggest that it is less. You do not need to design the simulation.