L3 Probability Distributions
Question Bank
For each situation, name the probability distribution that would be the most suitable model for $X$ (binomial, Poisson, normal, uniform or triangular). Give a reason for your choice.
(a) A rugby player succeeds with 80% of his penalty kicks at goal. $X$ is the number of his next 6 penalty kicks that are successful.
(b) A rural fire station is called out at random times, at an average rate of 3 call-outs a week. $X$ is the number of call-outs in one week.
(c) A battery-powered kitchen clock stops at a random moment when its battery runs flat. $X$ is the number of minutes past the hour shown by the minute hand when it stops.
(d) A machine fills bags of flour, set to put 1.5 kg in each bag. $X$ is the mass of a randomly chosen bag.
The birth weights of full-term babies born at a large hospital have a roughly symmetric distribution with a single peak. About 95% of these babies weigh between 2.6 kg and 4.4 kg.
A normal distribution is used to model these birth weights. Suggest values for the mean and standard deviation of this model, and explain how you got them.
At a woolshed, the time a shearer takes to shear one sheep varies from 1 minute to 3 minutes. It is most often about 1.5 minutes.
(a) Suggest a suitable probability distribution to model the time taken to shear one sheep. State its parameters.
(b) Explain why a normal distribution would not be a good model for this time.
An orchard in Hawke's Bay weighs a random sample of 200 apples from one block. The histogram shows their weights.
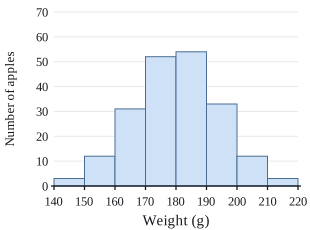
A normal distribution is to be used to model the weight of an apple from this block.
(a) The orchard's manager says the mean weight of these apples is about 180 g. Use the histogram to explain why this is a sensible value for the mean of the model.
(b) Suggest a value for the standard deviation of the model. Explain your choice using the histogram.
A fishing charter in the Hauraki Gulf measured every snapper its customers caught during one month. The histogram shows the lengths of the 120 snapper.
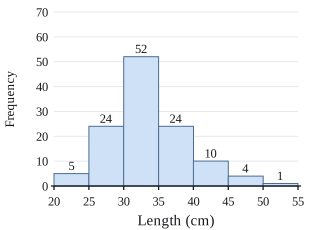
The charter's website says that more than 30% of the snapper its customers catch are 35 cm or longer.
Does this data support the claim? Support your answer with a calculation.
A council counted the number of people in each of 250 cars entering a city centre between 7.30 am and 8.30 am on a weekday. The bar graph shows the results.
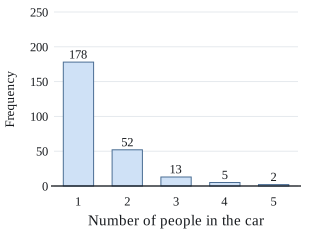
(a) A newspaper says that fewer than a quarter of cars in the morning rush carry more than one person. Does the data support this claim? Show a calculation.
(b) The council says that cars carry 1.5 people on average. Use the data to check this figure.
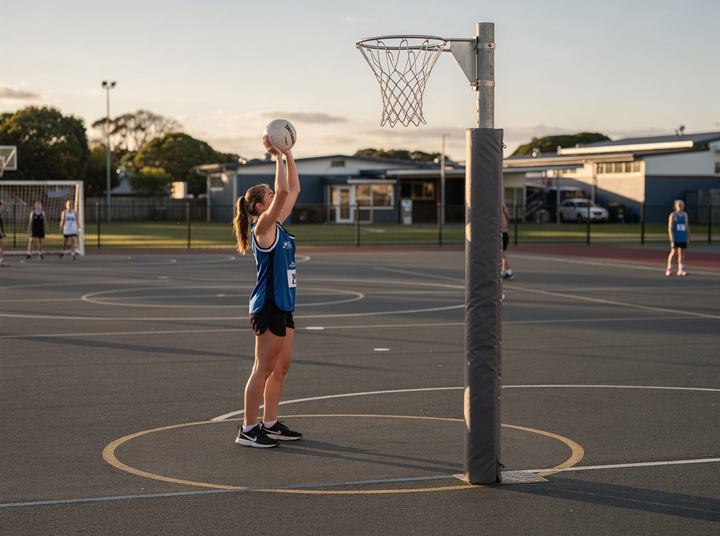
A netball goal shooter ends every training session by taking 6 shots from the edge of the shooting circle. Her coach models $X$, the number of the 6 shots she scores, with a binomial distribution, $n = 6$, $p = 0.7$.
Over two seasons she did this at 80 training sessions. The coach then simulated 1000 samples of 80 sessions from the model. In the plot, each grey band shows the middle 90% of the 1000 simulated relative frequencies for that number of goals, and the blue dots show her real results. (The first band is for 2 goals or fewer.)
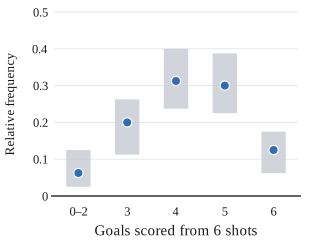
(a) Explain what the grey band for 4 goals shows.
(b) Discuss whether the binomial model is appropriate for her shooting. Support your answer with statistical reasoning.
Students at a large secondary school miss 8% of school days. A dean models $X$, the number of days a student is absent during a 5-day school week, with a binomial distribution, $n = 5$, $p = 0.08$.
The bar graph shows the number of days absent in one week for a random sample of 200 of the school's students.
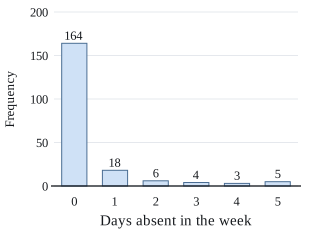
(a) Use the dean's model to estimate the probability that a student is absent on at least 3 days of the week.
(b) Compare your answer to (a) with the data. Is the binomial model appropriate? Give TWO reasons, in context.
A pizza shop recorded the delivery time (minutes from the order being placed to the pizza arriving at the door) for 150 deliveries. The histogram shows the times.
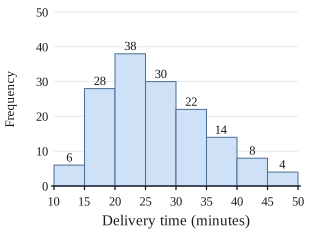
Suggest a suitable probability distribution to model the delivery time of an order. State its parameters, and justify your choice of distribution and parameters using features of the histogram and the context.
A museum's door counter records how many people come in through the main entrance in each minute. On average, 2 people come in per minute, so the manager models $X$, the number of people who come in during a one-minute period, with a Poisson distribution, $\lambda = 2$.
The counts for 120 one-minute periods on one day were compared with 1000 simulated samples of 120 one-minute periods from the Poisson model. In the plot, each grey band shows the middle 90% of the simulated relative frequencies, and the blue dots show the relative frequencies in the real data.
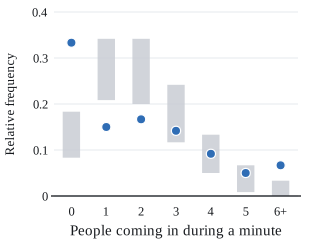
(a) For which numbers of people coming in during a minute is the real data not consistent with the model? Describe how the data differs from the model.
(b) Explain why a Poisson model may not be appropriate here. Give a reason in context.
A Department of Conservation ranger checks a line of stoat traps every week. Last year the line caught an average of 2.2 stoats per week, so the ranger models $X$, the number of stoats caught in a week this year, with a Poisson distribution, $\lambda = 2.2$.
The bar graph shows the number of stoats caught in each of the 50 weeks the traps were checked this year.
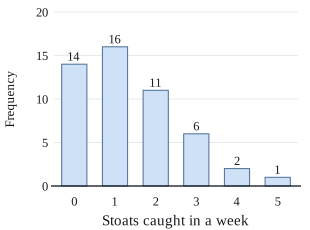
(a) Use the data to suggest a better value of $\lambda$ for this year. Explain why your value is better.
(b) Use your value of $\lambda$ to estimate the probability that no stoats are caught in a week. Compare your answer with the data, and with the model that uses $\lambda = 2.2$.
A courier company tells customers in a small town that their parcels will be delivered between 9 am and 1 pm. A manager models $X$, the number of minutes after 9 am that a parcel is delivered, with a uniform distribution, $a = 0$, $b = 240$.
The delivery times of 160 parcels were recorded in half-hour classes (0–30 minutes after 9 am, 30–60 minutes, and so on). The plot compares them (blue dots) with 1000 simulated samples of 160 delivery times from the uniform model: each grey band shows the middle 90% of the simulated relative frequencies.
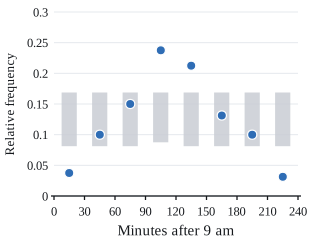
(a) Discuss whether the uniform model is appropriate for the delivery times. Support your answer with statistical reasoning.
(b) Propose a better probability distribution model for the delivery time of a parcel. State its parameters, and justify your choices in context.
A city's e-bike hire app recorded the distance of 250 rides. The histogram shows the distances.
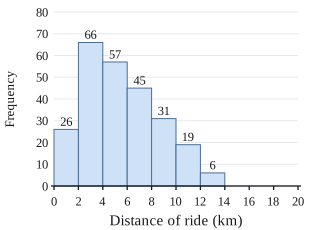
An analyst models $X$, the distance of a ride (km), with a triangular distribution, $a = 0$, $c = 5$, $b = 20$.
(a) Suggest better parameters for a triangular model of the ride distances. Justify each parameter using the histogram.
(b) The analyst's model estimates the probability that a ride is longer than 6 km as 0.6533. Use your model to estimate this probability, and compare both estimates with the data.
An orchard in Te Puke weighed a random sample of 200 kiwifruit from one block. The histogram shows the weights. The sample mean was 99.9 g and the standard deviation 11.9 g; the lightest fruit weighed 66 g and the heaviest 134 g.
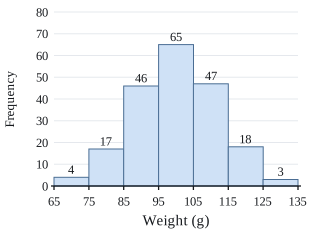
Two models are suggested for $X$, the weight (g) of a kiwifruit from this block:
Model A: normal, $\mu = 100$, $\sigma = 12$
Model B: triangular, $a = 65$, $c = 100$, $b = 135$
Kiwifruit lighter than 85 g are sold on the local market instead of being exported.
(a) Use the histogram to find the proportion of the sample that is lighter than 85 g.
(b) Use each model to estimate the probability that a kiwifruit is lighter than 85 g.
(c) Which model would you recommend for the weights of kiwifruit from this block? Justify your recommendation using your answers and features of the data and the models, in context.